Case study 01 · Subaru of New England
Untangling a complex vehicle allocation process.
Modernizing a recurring operational workflow connecting Sales Operations, six districts, and a 65-retailer network.
- Role
- Lead Designer
- Product
- Retailer Operations Platform
- Scope
- Vehicle Allocation
- Network
- 65 Retailers · 6 Districts
Context
Every month, vehicles had to move through a network of people, systems and decisions.
Subaru of New England distributes vehicles to Subaru retailers across the region. Each month it receives vehicle supply and decides which retailer gets which vehicles. That decision, and everything needed to carry it out, is called allocation.
- Vehicle supply
- Subaru of New EnglandSales Operations
- 6 districtsDistrict Sales Managers
- 65 retailers
Three groups take part
Sales Operations
Prepares and runs the allocation at Subaru of New England.
District Sales Managers
Six of them, each managing allocation for the retailers in a district.
Retailers
65 Subaru retailers that need to know what they have been allocated, and act on it.
The real problem
The interface was old. The bigger problem was underneath it.
The brief looked like a modernization project. Mapping the process showed something else: allocation had become a fragmented workflow, spread across separate applications, reports, a spreadsheet and a series of handoffs between roles.
Current-state process map
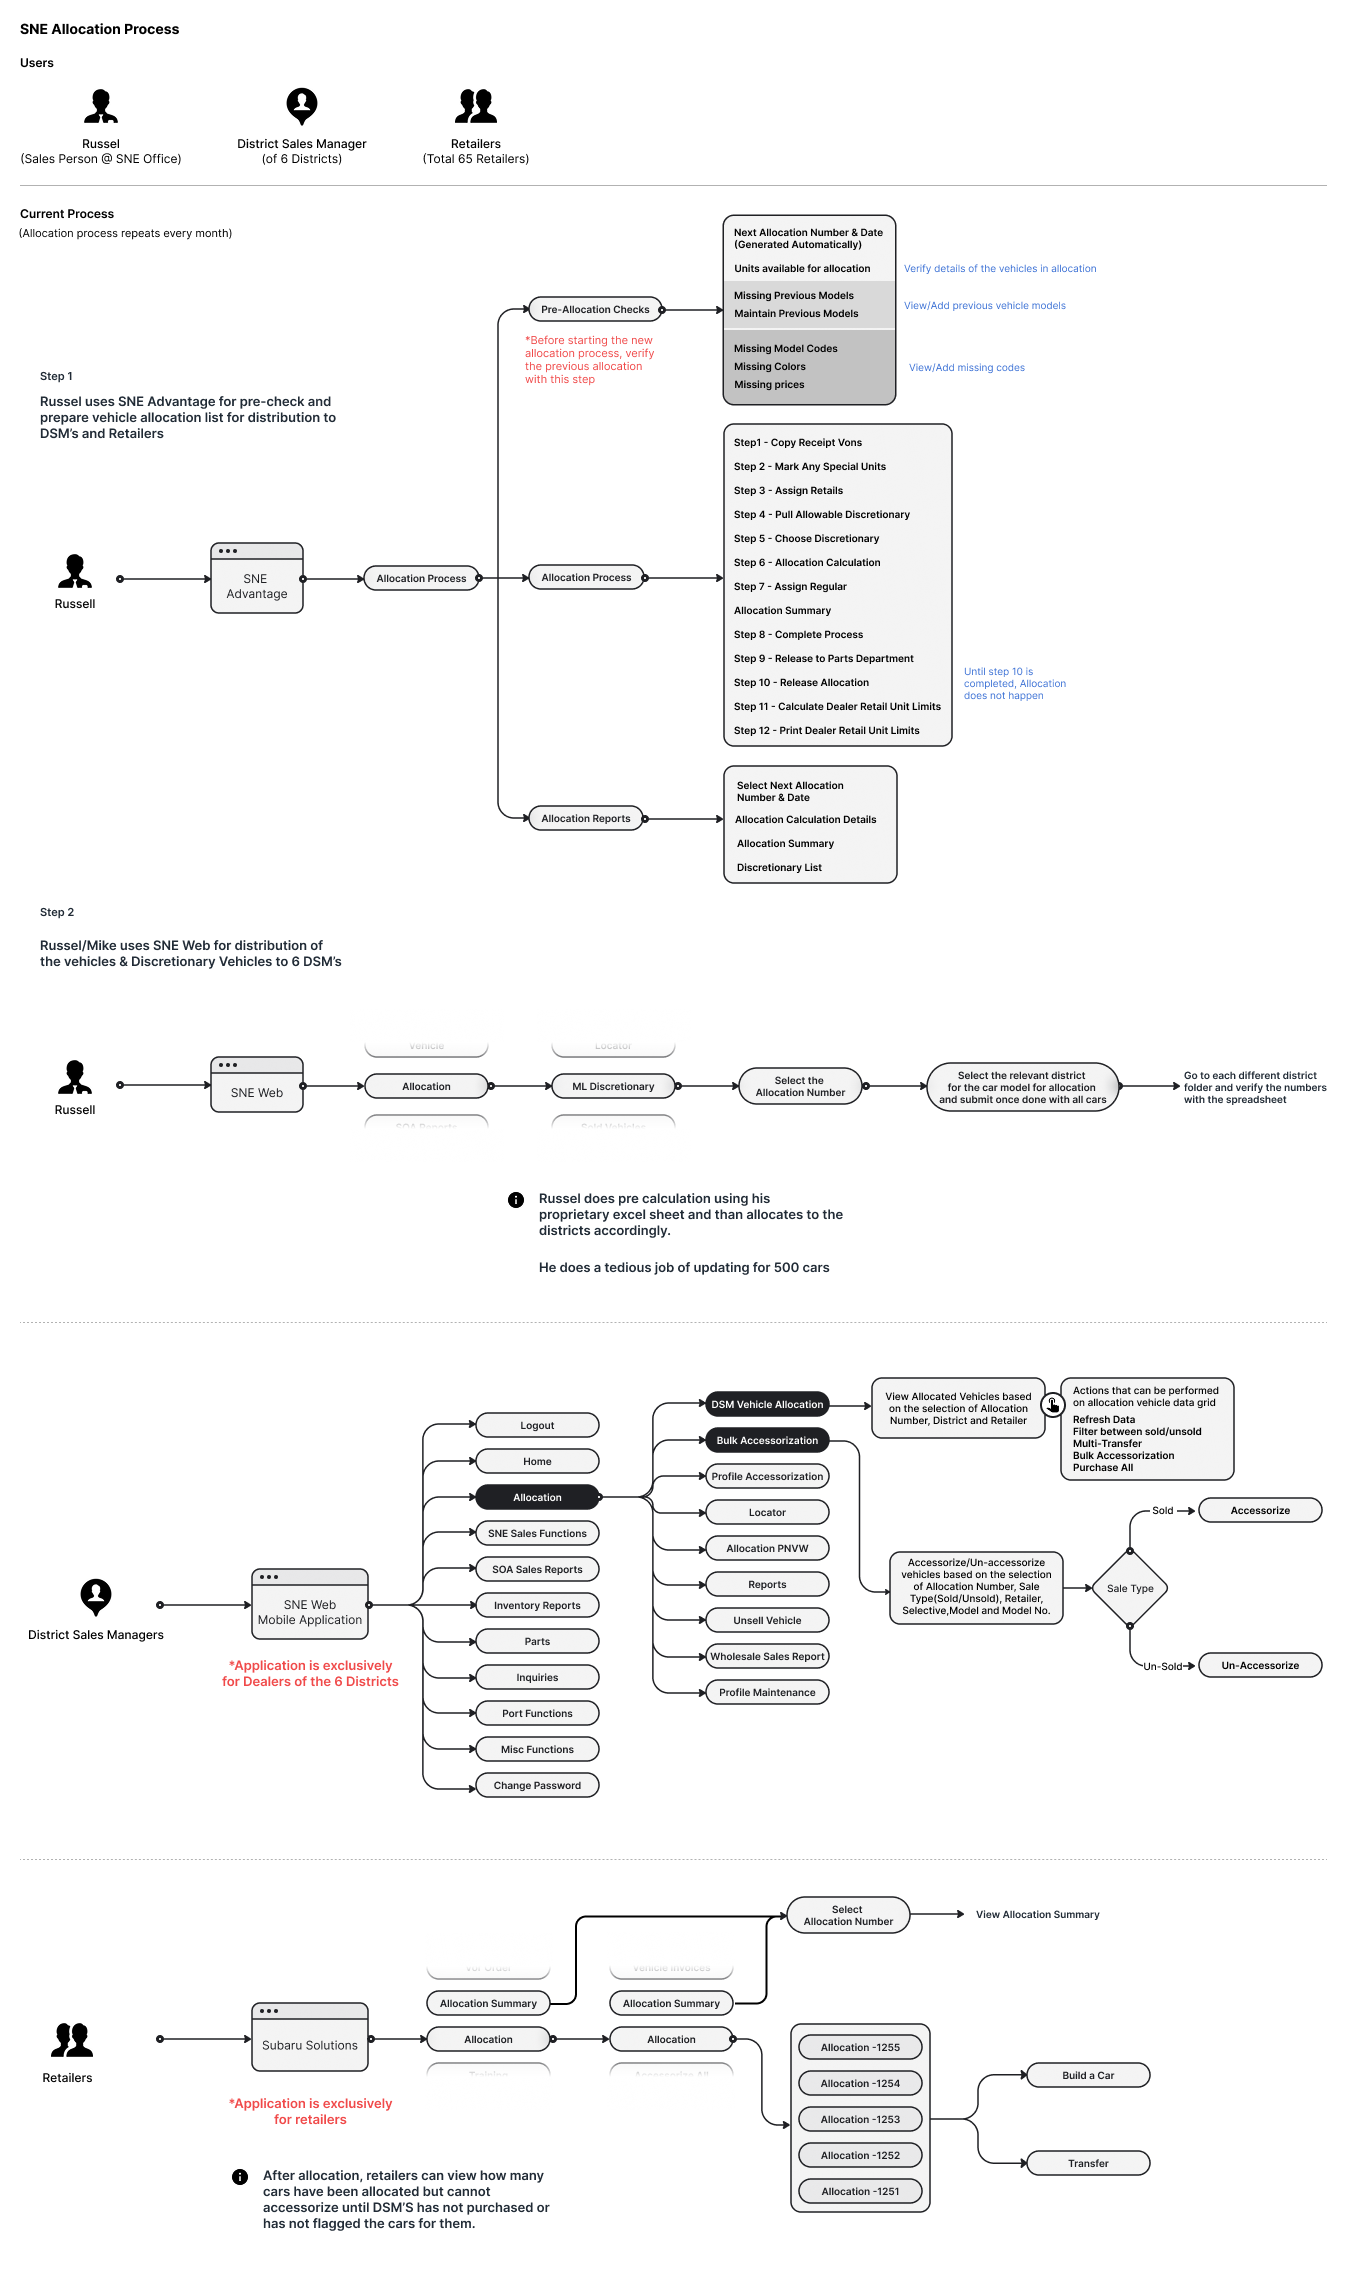
The same process, in plain terms
| Who | Where they worked | What happened there |
|---|---|---|
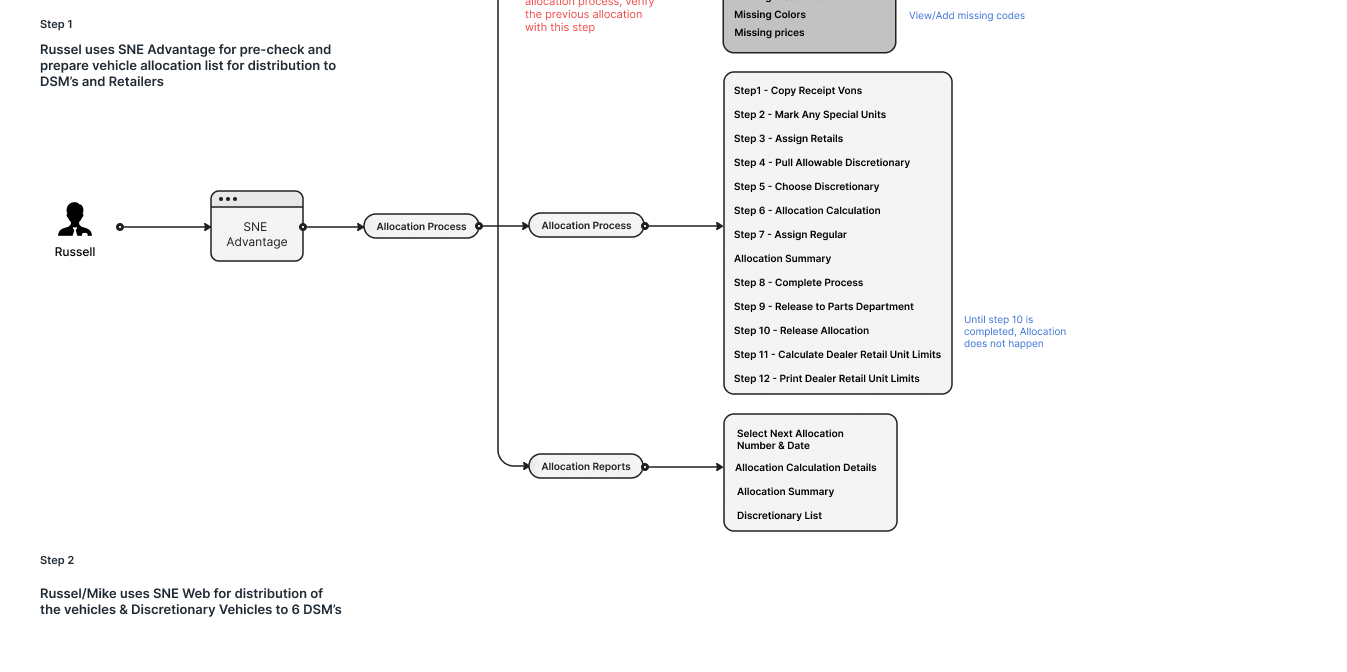
| Sales Operations | SNE Advantage | Pre-allocation checks, a roughly 12-step allocation process, and allocation reports. |
| Sales Operations | SNE Web + a spreadsheet | Distributing vehicles and discretionary vehicles to the six districts, then checking the numbers against the spreadsheet. |
| District Sales Managers | A separate mobile application | Viewing allocated vehicles by allocation, district and retailer; accessorizing; purchasing. |
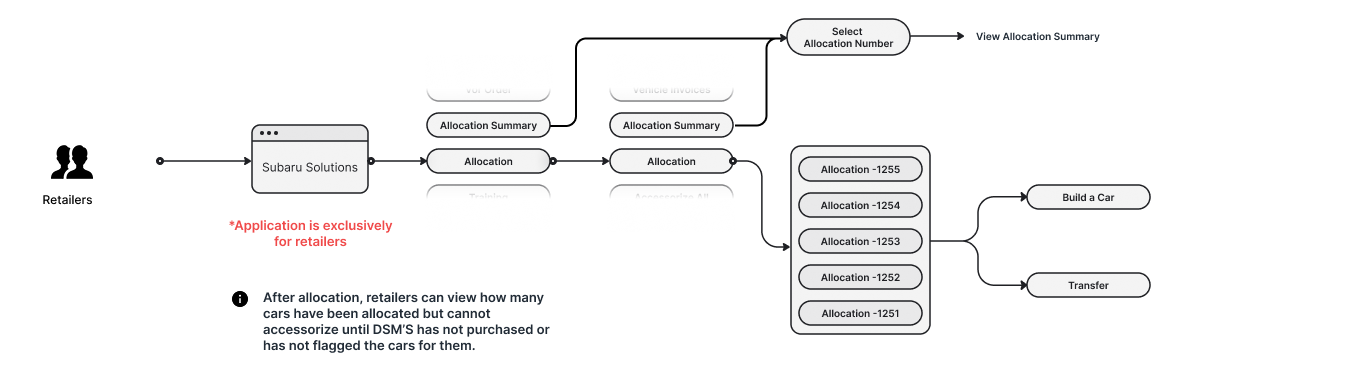
| Retailers | Subaru Solutions | Viewing the allocation summary, then building a car or transferring a vehicle. |
Scale of the workflow
- Primary roles
- 3
- Primary roles
- Steps in the core allocation process
- ~12
- Steps in the core allocation process
- Vehicles updated by hand in one part of the legacy workflow
- ~500
- Vehicles updated by hand in one part of the legacy workflow
Understanding the operating model
Before redesigning screens, I mapped how the work actually moved.
This was not a large formal research study. I worked from the existing systems and their outputs, from the domain knowledge of the people who ran the process, and from a small number of retailer visits that gave me context for how the work looked on the receiving end.
The questions were simple. Who is involved? What is each role responsible for? Where does information move, and where does the work cross from one system to another?
Detail · Sales Operations
Detail · Retailers
Key insight
One process didn't mean one experience.
The three groups were part of the same allocation, but they were doing different jobs with it.
Sales Operations
Prepare and manage the allocation. Highest complexity, highest control.
District Sales Managers
Understand and manage allocation for their district. District-level visibility and actions.
Retailers
Understand what has been allocated to them. A few focused downstream actions.
Reframing the system
From fragmented tools to role-aware workflows.
The challenge was to create one coherent experience without exposing every function to every user. Giving everyone the same dashboard would have moved the complexity, not reduced it.
The proposed structure brings the three roles into a single application. Each role lands on its own screen, and the allocation area opens onto the capabilities that role is responsible for.
Proposed process
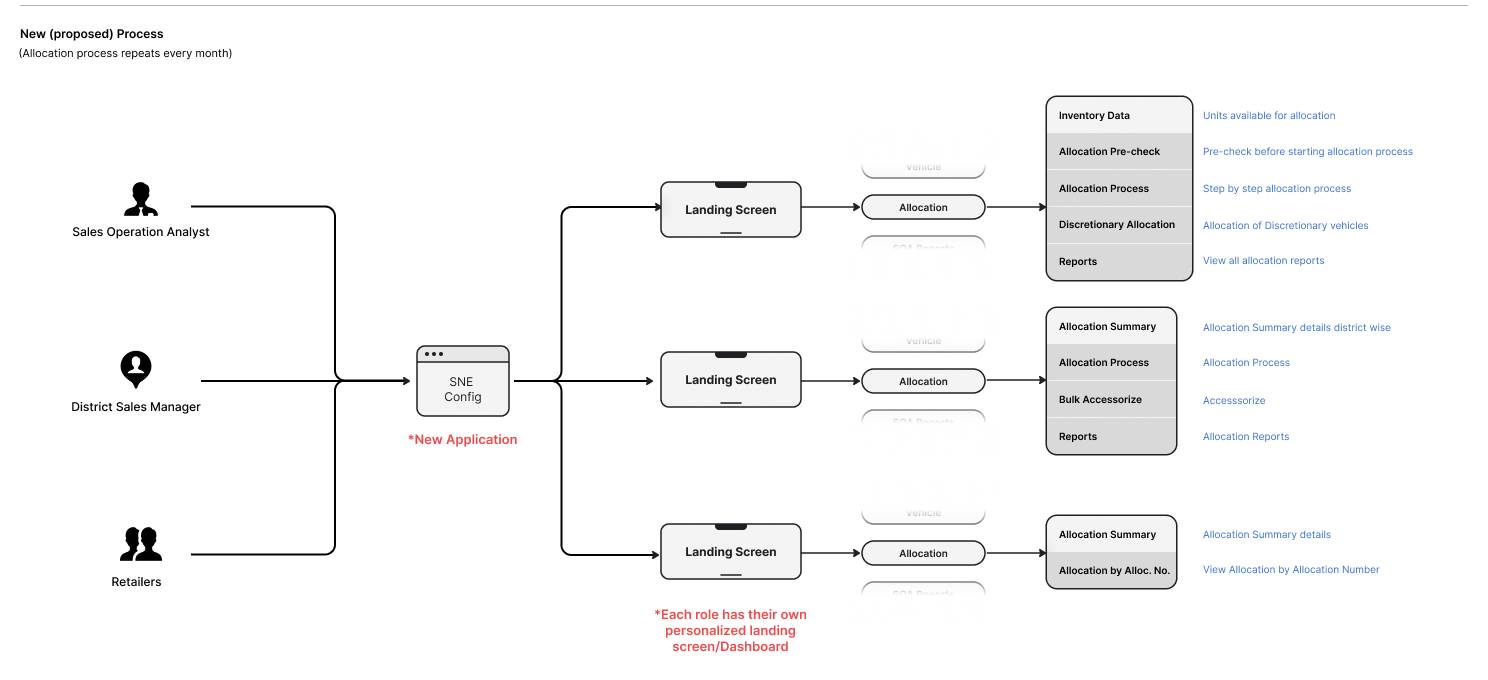
What each role gets in Allocation
Sales Operations
Inventory data, allocation pre-check, the step-by-step allocation process, discretionary allocation, reports.
District Sales Managers
District allocation summary, allocation process, bulk accessorize, reports.
Retailers
Allocation summary, and allocation by allocation number.
Redesigning allocation
From raw allocation data to operational awareness.
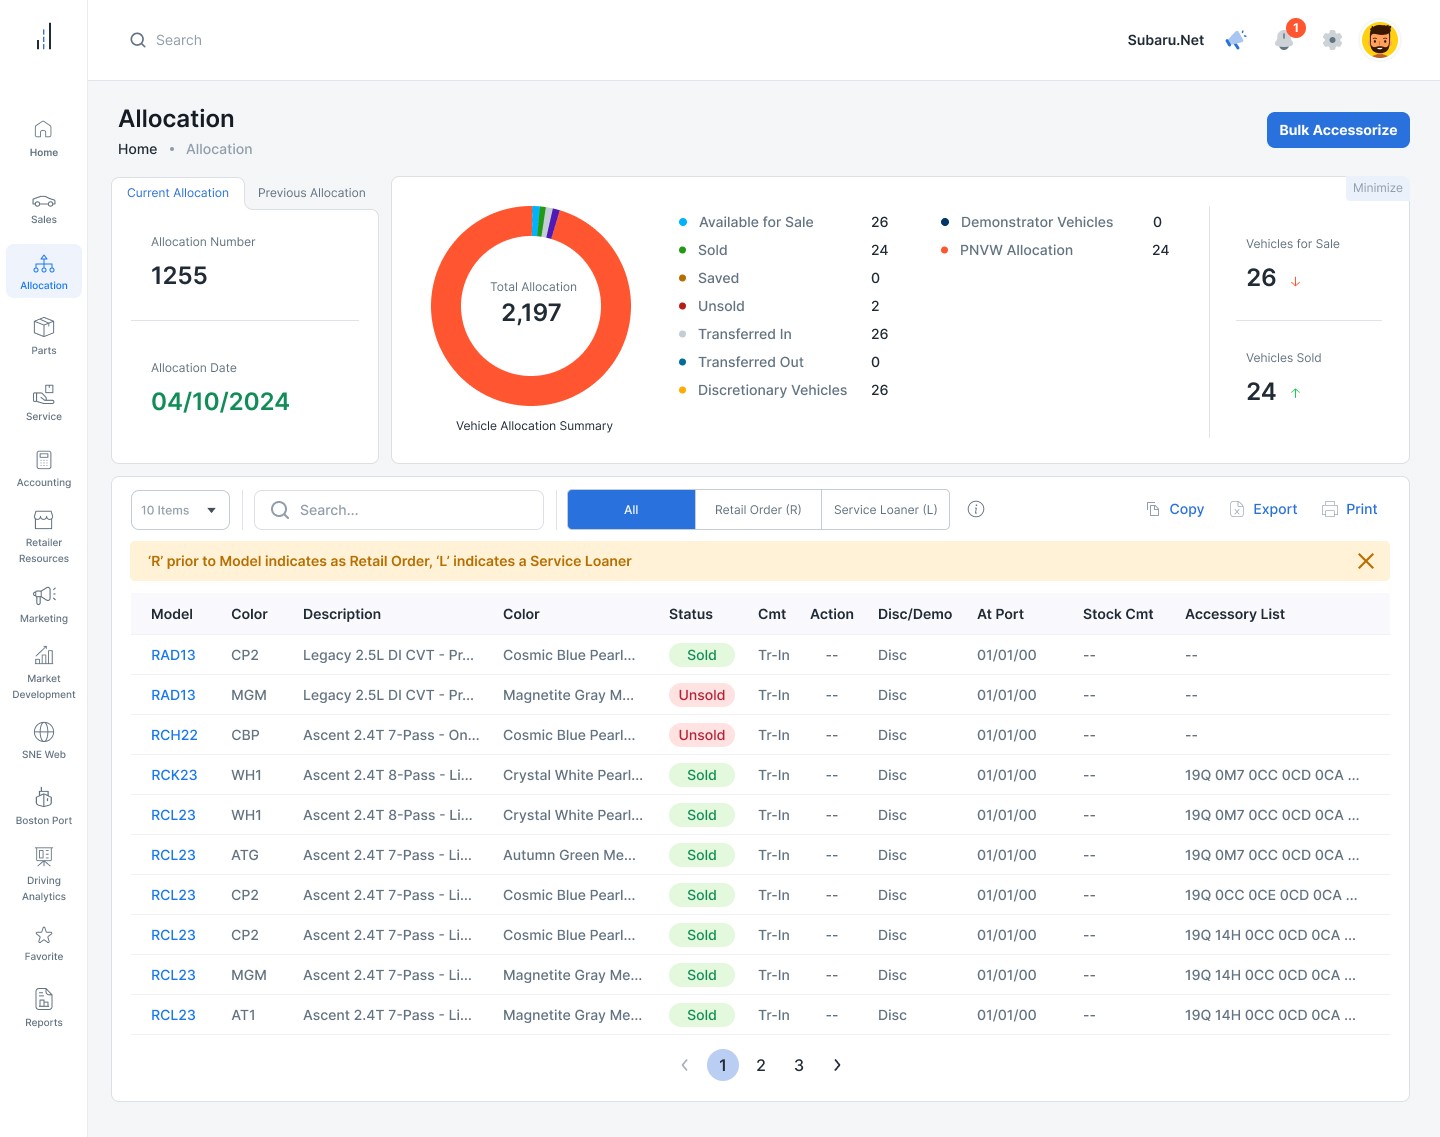
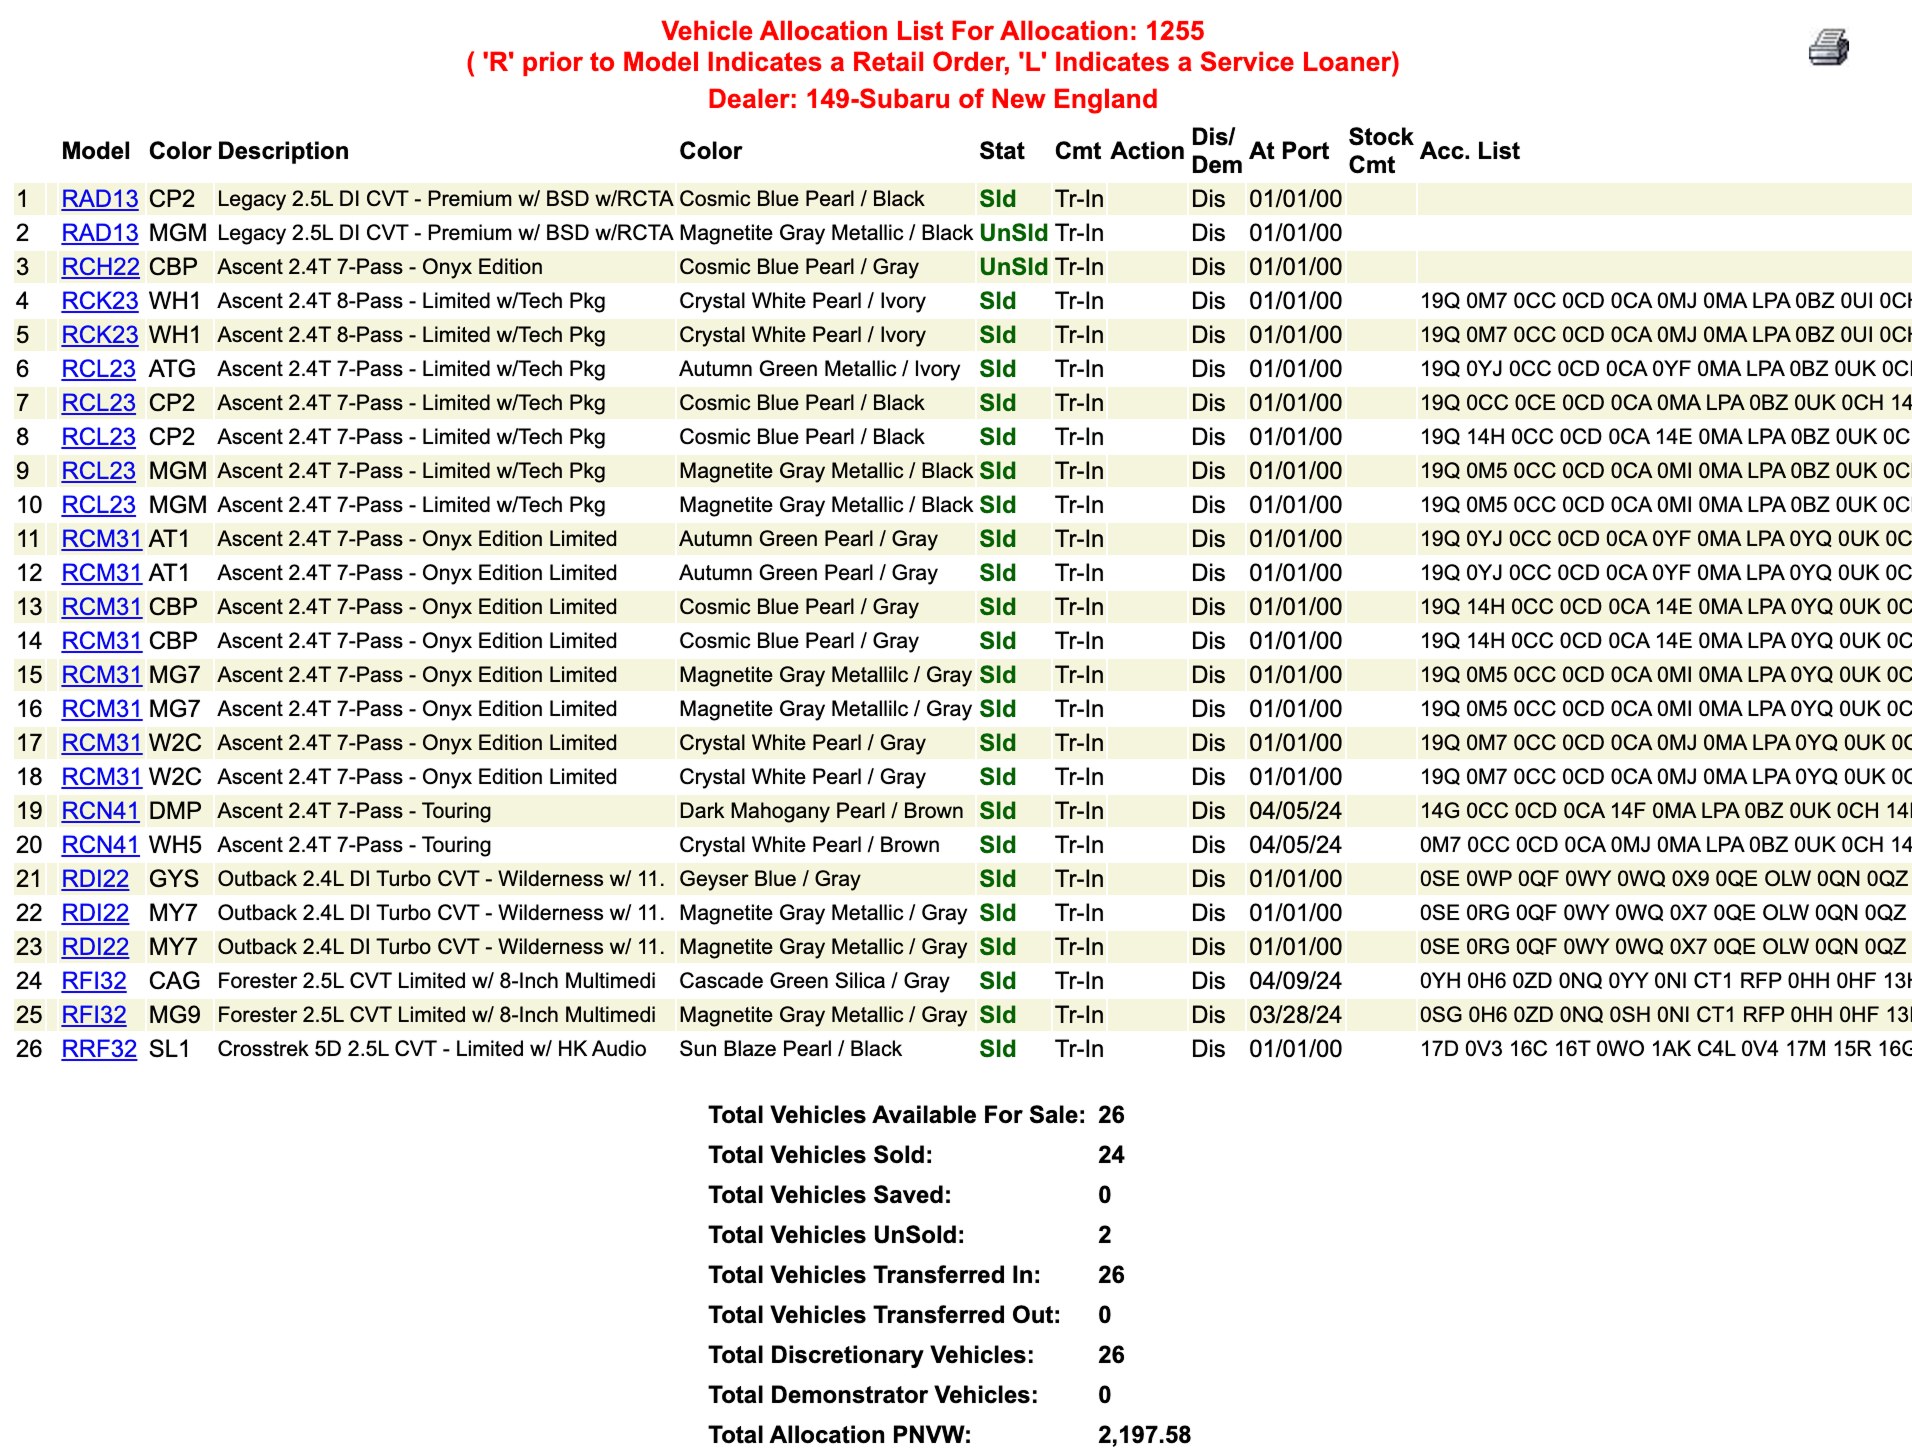
Before · Legacy allocation list
After · Redesigned Allocation
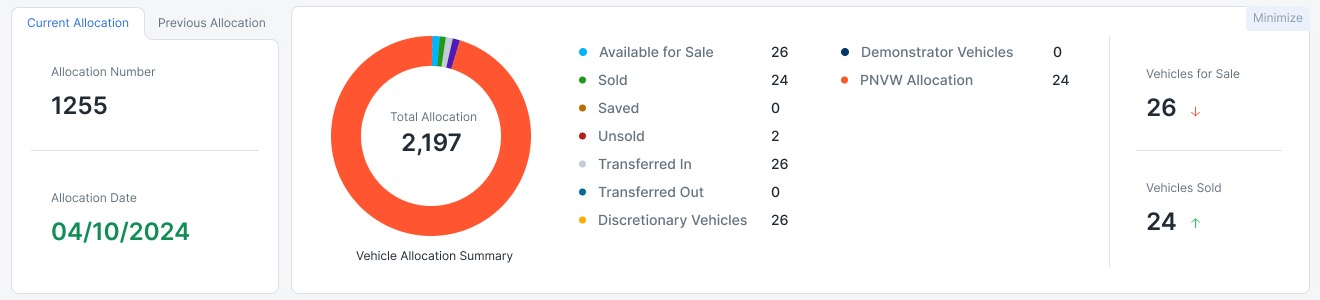
- 1ContextWhich allocation am I looking at? Number and date, with the previous allocation one tab away.
- 2OverviewThe allocation as a whole, before any single vehicle.
- 3StatusAvailable, sold, saved, unsold, transferred in and out, discretionary.
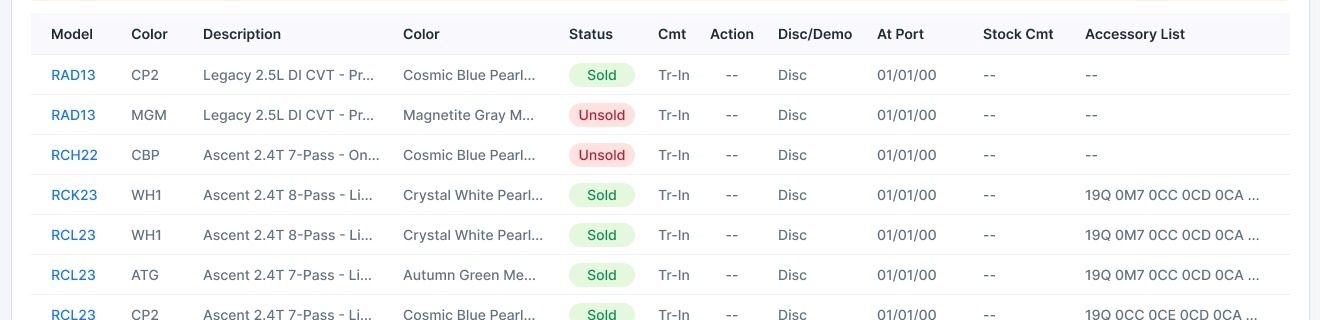
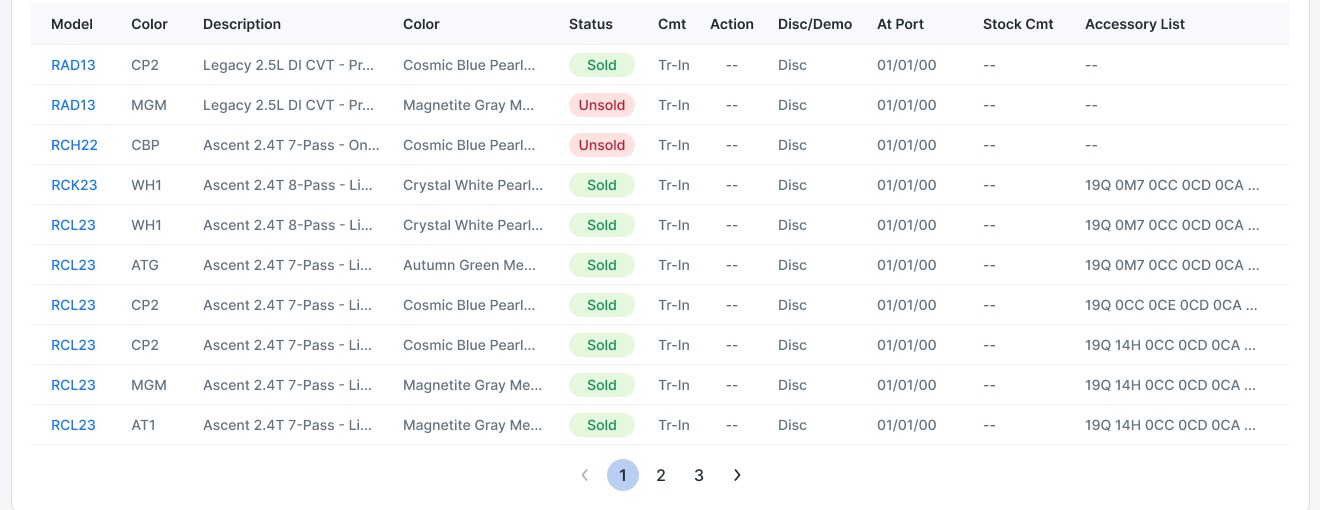
- 4Vehicle detailOne row per vehicle, with model, color, status and accessory list.
- 5ActionsSearch, filter by order type, copy, export, print, bulk accessorize.
Overview → Detail → Action
Understand the whole, inspect the part, then act.
01 · Overview
02 · Detail
03 · Action

Simplifying without oversimplifying
Operational software still needs information density.
People who run an allocation need to compare many vehicles at once. Removing columns to make the screen look clean would have made them slower, so the table keeps its eleven columns.
The work went into hierarchy instead: a summary above the table, status as a colored label, truncation where full text isn't needed to decide, and search and filters to narrow the set.
The question wasn't “How can I show less?”
It was “What needs to be understood together?”
Broader retailer ecosystem
Allocation was only one part of the system.
The same retailer platform also supported custom vehicle orders, network inventory and vehicle transfers, giving retailers a more connected operational experience.
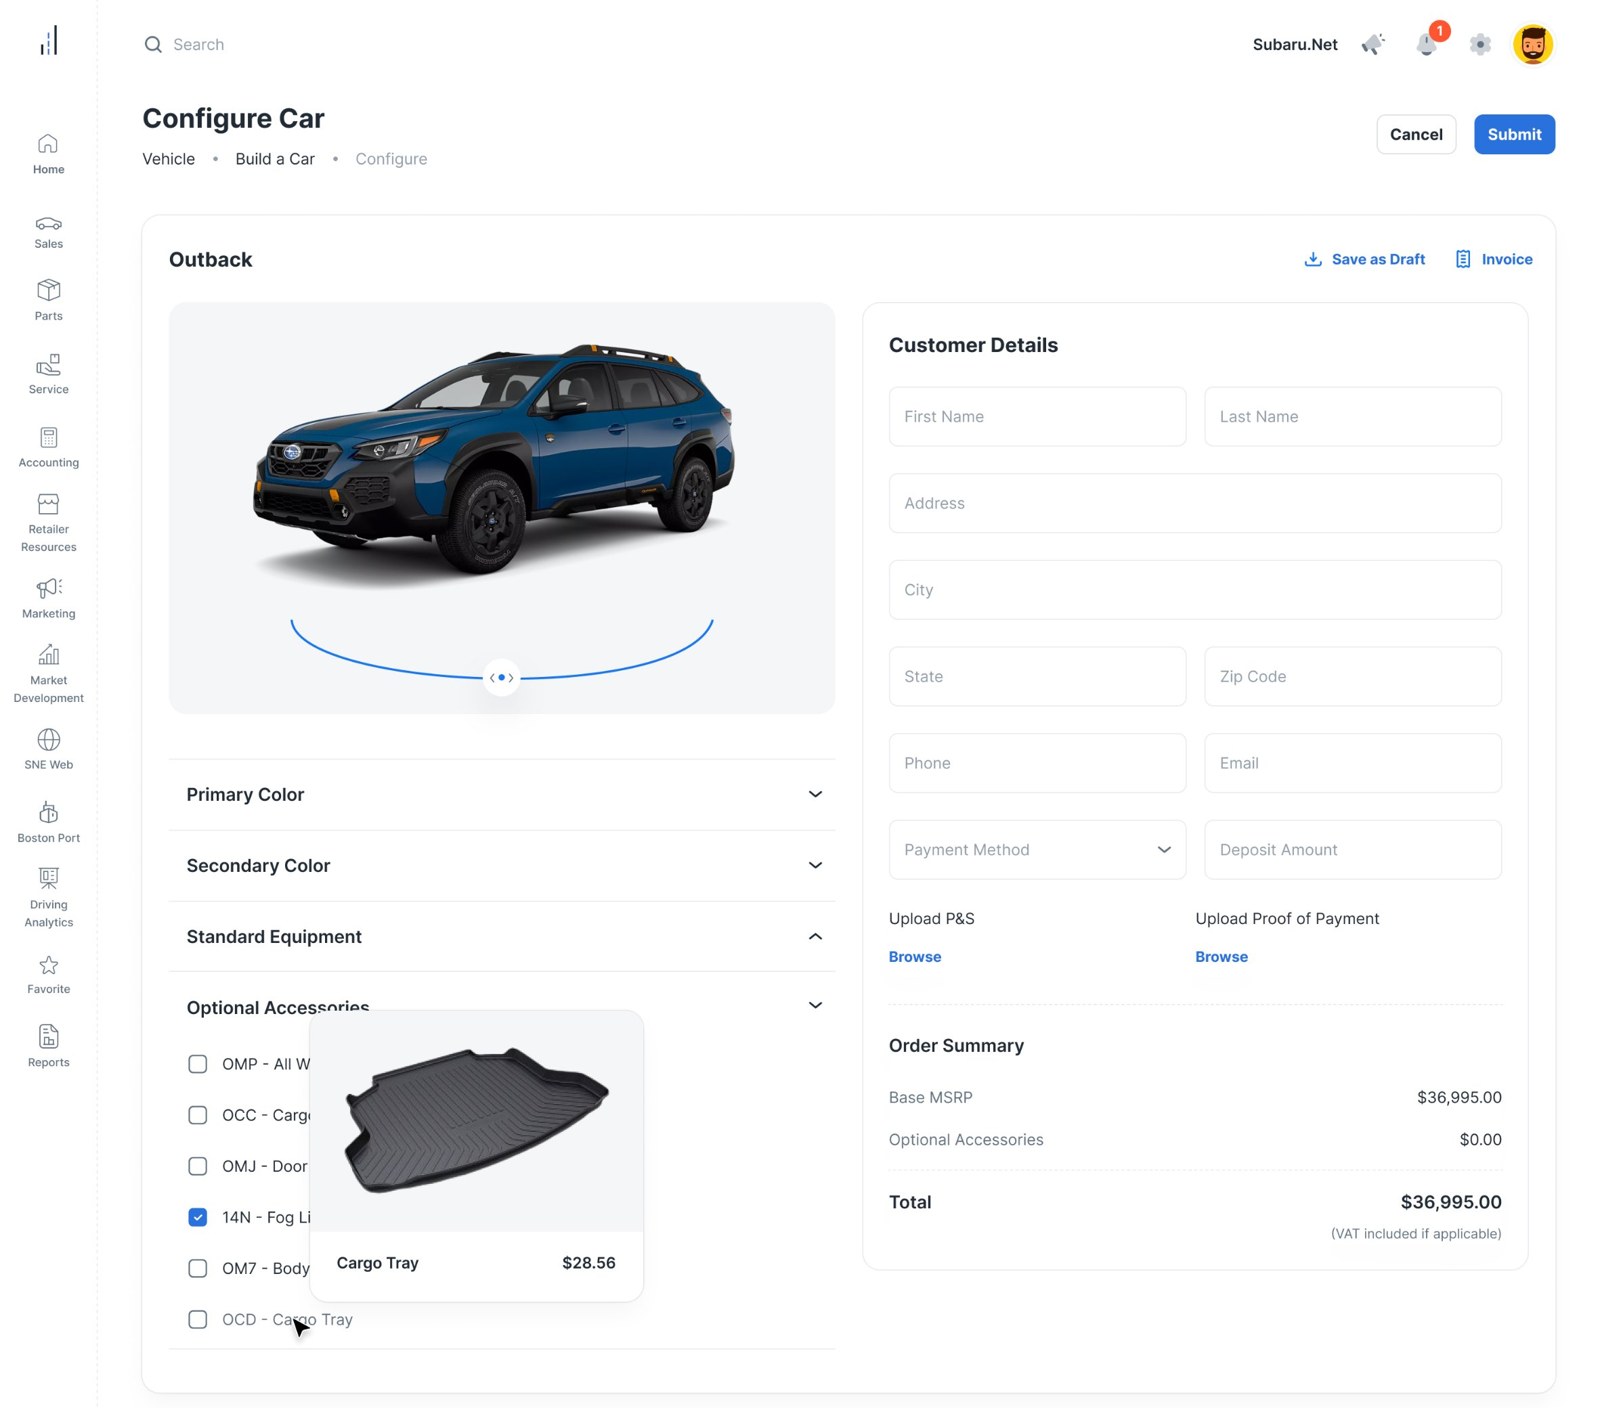
Build a Car
Configure a customer order, add options and customer details, save a draft, submit.
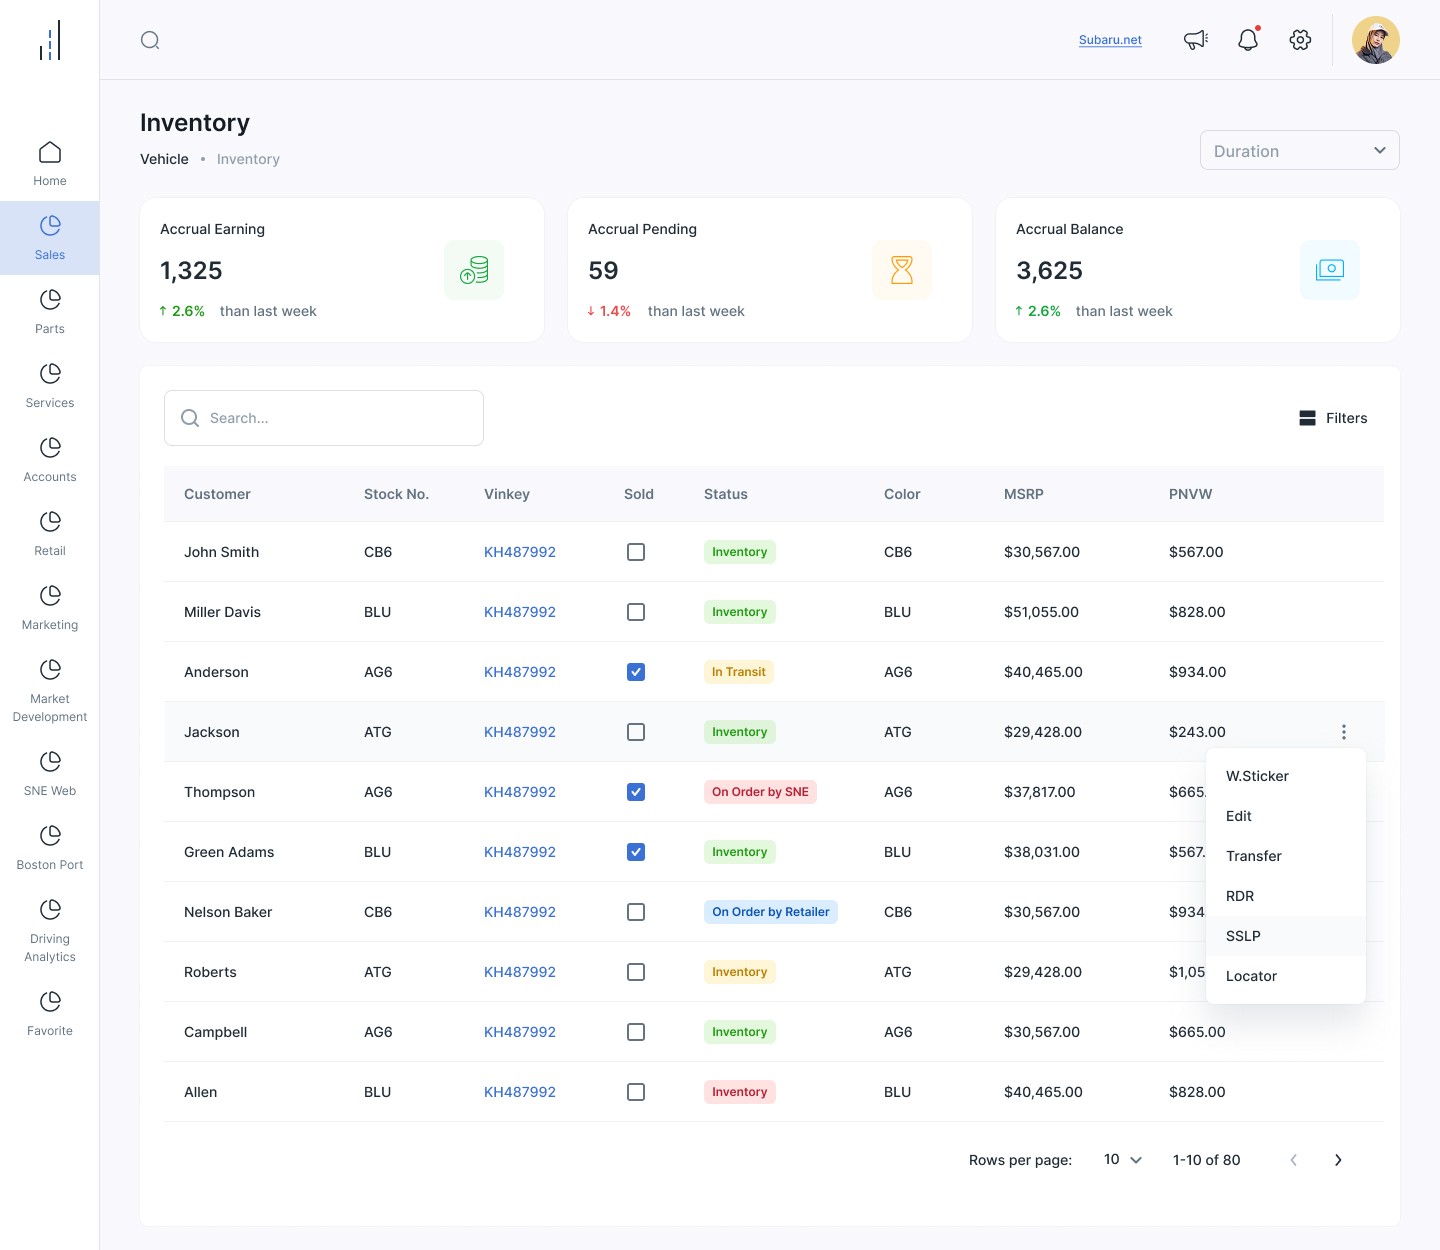
Inventory
See what is in inventory, in transit or on order across the network.
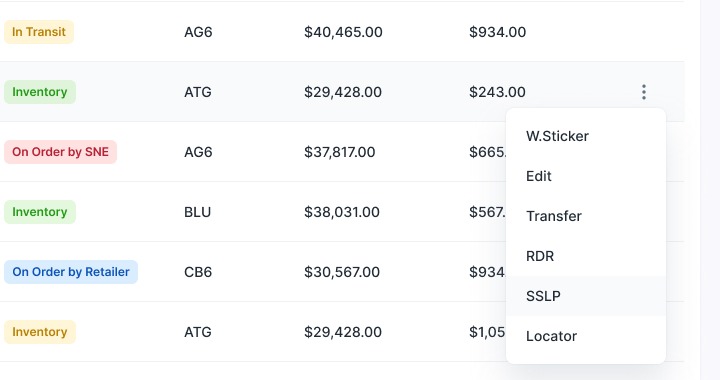
Transfers
Move vehicles between retailers, started from the vehicle itself.
Reflection
Complexity isn't always something to remove
In operational products, complexity often represents real business rules, dependencies and decisions. My job wasn't to hide all of it. It was to tell accidental complexity from necessary complexity, then make the system easier to understand and operate.
The product is more than the screen
This project reinforced another lesson: the product is also the rules, states, permissions and behaviors underneath what is visible.